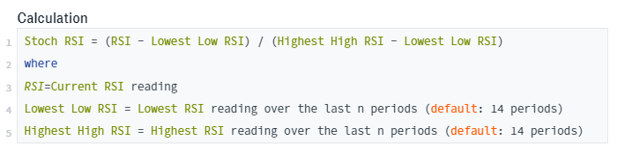
The Stochastic RSI or StochRSI is a momentum oscillator that measures the level of the RSI (Relative Strength Index) relative to its high low range over the time period set by the user.
This indicator applies the Stochastic Oscillator formula to the RSI values to arrive at its value. Since, the calculation is based on the indicator of the price, rather than price itself, it is referred to as a second derivative of the price, or as an indicator of an indicator. This means that price has undergone two changes to become StochRSI. Converting prices to RSI is one change. Converting RSI to the Stochastic Oscillator is the second change.
The resulting indicator, like the RSI fluctuates between two values 0 and 100. Originally, the fluctuation was between 0 and 1, but most modern technical analysis convert it to 0 and 100 for easier interpretation.

The indicator was created by Tushar Chande and Stanley Kroll and introduced in their 1994 book, The New Technical Trader. Chande and Kroll explained that the RSI has a tendency to oscillate between 80 and 20 for extended periods without reaching extreme levels. Hence, traders looking to enter a stock based on an overbought or oversold reading in RSI might find themselves waiting on the sidelines without any trade signals. The StochRSI on the other hand increases the sensitivity of the RSI and generates more overbought/oversold signals.
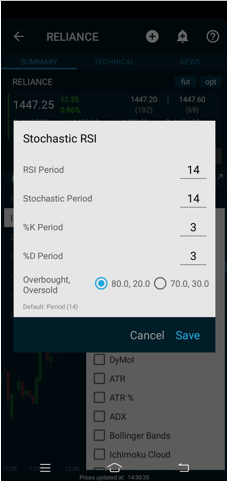
The StochasticRSI has 4 variables:
- RSI Period: The number of RSI periods used in the Stochastic Calculation. (default: 14)
- Stochastic Period: This is the number of time periods used in the stochastic calculation. (default: 14)
- %K Period: This value smoothes the Stochastic Period with a simple moving average. A value of 1 maintains the stochastic period. (default: 3)
- %D Period: A moving average of %K (default: 3)
Interpretation
StochRSI has characteristics similar to most bound momentum oscillators.
First, it can be used to identify overbought or oversold conditions. A move above 80 is considered overbought, while a move below 20 is considered oversold. It is important to look for oversold conditions when the bigger trend is up and overbought conditions when the bigger trend is down. In other words, look for trades in the direction of the bigger trend as the Stochastic RSI is a short term indicator.
Second, it can be used to identify the short-term trend. As a bound oscillator, the center line is at 50. StochRSI reflects an uptrend when consistently above 50 and a downtrend when consistently below 50.
One can also look for divergences and convergences with this oscillator as a leading indicator for signalling trends and reversals.
Case Study
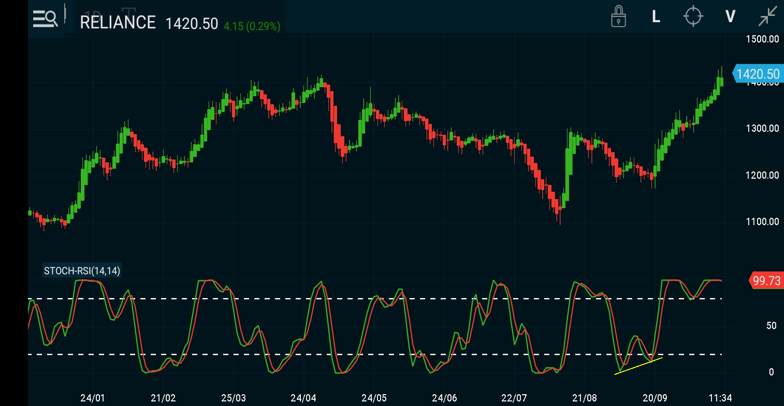
Reliance Daily Chart
One can study, the daily chart of Reliance to see how the Stochastic Oscillator retrieving from overbought and oversold conditions offers excellent trading opportunities.
Conclusion
StochRSI is like RSI on steroids. RSI produces relatively fewer signals and StochRSI dramatically increases the signal count. There will be more overbought/oversold readings, more centerline crosses, more good signals and more bad signals. Speed comes at a price. This means it is important to use StochRSI with other aspects of technical analysis for confirmation.
The examples above use gaps, support/resistance breaks, and price patterns to confirm StochRSI signals. Chartists can also employ other complementary indicators, such as On Balance Volume (OBV) or the Accumulation Distribution Line. These volume-based indicators do not overlap with momentum oscillators. Chartists should also experiment with various settings and learn the nuances of StochRSI before using it in the real world.