In our earlier sessions, we learnt to classify indicators and then to combine a few of them into a profitable trading system. You can access our earlier articles from the links below:
Article 1- Introduction to Course: Building effective trading strategies using indicators
Article 2- Find trend and momentum combining Parabolic sar & Stochastic Oscillator
Article 3- Trading Pullbacks with Bollinger Bands & RSI
Article 4- Average True Range (ATR) - “Average or Excellent?”
Today, let’s take a look at the most popularly used indicators by traders - the Supertrend and learn to combine it with a momentum indicator the CCI (Commodity Channel Index) to further improve its performance.
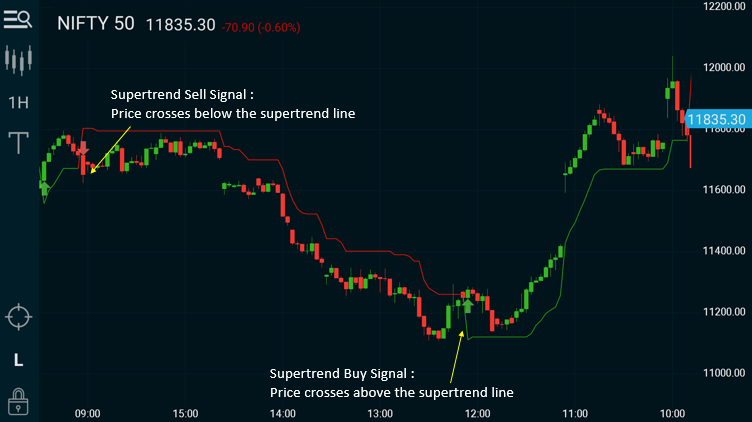
Supertrend
The Supertrend is constructed using the ATR (Average True Range) indicator with a multiplier and has two inputs - ATR period and the multiplier. Since the behaviour of the Supertrend is linked the ATR, I highly recommend you to read our earlier article on ATR to get a better understanding before diving further into Supertrend.
Supertrend has become very widely used primarily because of its simplicity. Though, the basis of the Supertrend is volatility , it has become widely accepted as a trend following indicator from a trading point of view.
You can also read our earlier posts from Market Vidhya on Supertrend:
Intraday Trading using Supertrend Indicator
Trading Strategies using Supertrend
CCI
CCI was first developed by Donald Lambert and featured in Commodities magazine in 1980. CCI was originally used to identify cyclical turns in commodities, but the indicator is used across indices, stocks and other securities now.
What is CCI?
CCI measures the current price level relative to an average price level over a given period of time. CCI is relatively high when prices are far above their average, but is relatively low when prices are far below their average. In this manner, CCI can be used to identify overbought and oversold levels.
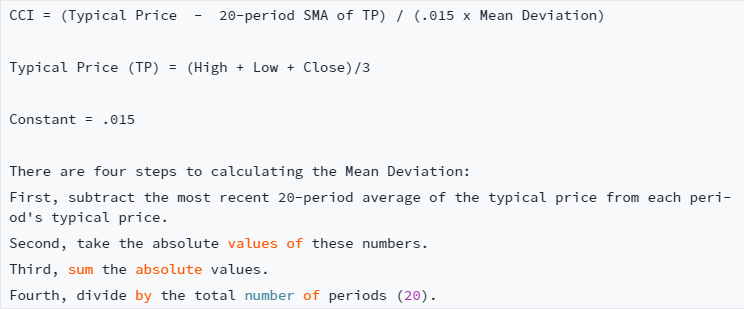
Calculation
The example below is based on a 20-period Commodity Channel Index (CCI) calculation. The number of CCI periods is also used for the calculations of the simple moving average and Mean Deviation.
Interpretation
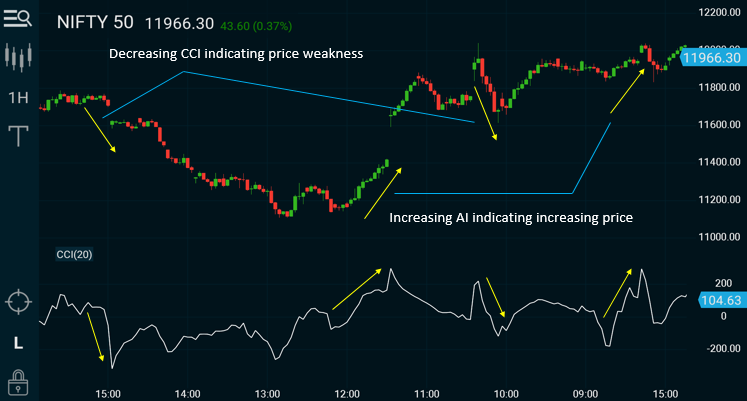
CCI measures the difference between a security's price change and its average price change. High positive readings indicate that prices are well above their average, which is a show of strength. Low negative readings indicate that prices are well below their average, which is a show of weakness as you can see from the image below.
Trading Strategy
With this strategy our intention is to use the Supertrend(7,3), to determine the direction in which the stock is trending and use the 14 period CCI readings when it is reversing from oversold and overbought conditions to initiate long and short trades respectively.
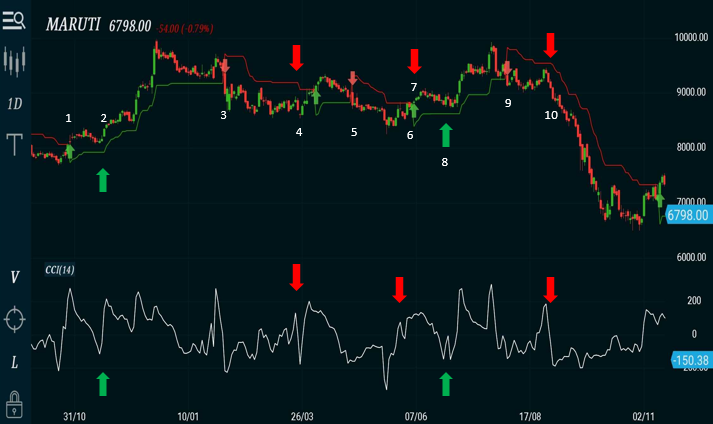
If we look at the Maruti chart above, Supertrend(7,3) gave a buy signal on 27th Oct(1). The CCI was in a heavily overbought position at that point. The price also moved sideways for several days post that. Our opportunity arrives on 16th Nov 2017, when the CCI reverses for the first time after falling, and the Supertrend is still in Buy mode. We go long on the open at 17th at 8218 with a SL of 7928 and ride the trend all the way to 9996. What this strategy does is it helps us sit out of the entire sideways move between the 27th of Oct to 16th of Nov and enter only when the trend restarts.
Similarly, the sell signals generated at 3 & 5, we only enter the positions at 4 & 6 where our stop losses are triggered. The positions entered at 8 & 10 give us handsome gains.

Entries & Exits for Long & Short Trades
Long Entry
- Price is higher than Supertrend (7,3)
- CCI(14) crosses above -100
- By observation of the chart ensure, it is the first time CCI has crossed above -100 after the Supertrend crossed over. Only take the trade if this condition is satisfied.
Stop Loss
- Price closes below Supertrend
Price Target
- Book 50%-75% of your profits when price reaches 3 times of your initial stop loss and trail the remaining position with Supertrend level
Short Entry
- Price is lower than Supertrend (7,3)
- CCI(14) crosses below +100
- By observation of the chart ensure, it is the first time CCI has crossed below +100 after the Supertrend crossed over. Only take the trade if this condition is satisfied.
Stop Loss
- Price closes above Supertrend
Price Target
- Book 50%-75% of your profits when price reaches 3 times of your initial stop loss and trail the remaining position with Supertrend level
Creating An Alert on Market Pulse
We can use the Alerts on Market Pulse to set the first two conditions to automatically alert us when they are satisfied. However, the condition for bullish or bearish divergence is the discretionary part which has to be manually observed by the user for the alerts the user gets, in order to decide whether he will take the trade or not. The below video shows you how you can go ahead and set these alerts.
Conclusion
When the Supertrend is used on its own, the trader enters his position as soon as the buy/sell signal is generated. In our case, we prefer to wait for the first pullback after the Supertrend gives the signal and then enter the position only when the CCI shows a reversal.
This method ensures we only enter pullbacks, which helps us keep smaller stop losses and still get to ride large trends. An important point to note is that we enter our positions only on CCI reversal. So, in cases when the CCI does not reverse, and Supertrend reverses, we won’t enter the trade. This removes several trades where the Supertrend can get choppy in sideways markets.
Go ahead and try this alert on your favourite stocks and hopefully, you can improve your trading results.
Setting up Buy Alert
Setting up Sell alert