A trader need the markets to move and create trends in order to create trading opportunities. Thus, Volatility can be called a trader’s best friend and volatility indicators are essential part of their toolkit.
Today, I want to focus your attention to one such volatility indicator, the Average True Range (ATR).
The Origin of ATR?
Trader, author, and technician J. Welles Wilder developed average true range (ATR) in the 1970’s. Wilder believed that the range - the difference between the high and low for a given period be it intraday, daily, weekly, or monthly - was directly proportional to volatility, and that range was indicative of a trend.
If the volatility of a stock increased, it was entering a trend, and if it slowed down, it suggested a reversal. He further refined the trading range, calling it a true range when he included changes in price that occurred from the previous day’s close rather than starting from the opening price. News, such as after-hours announcements that would expose the market to open higher or lower next day would not be accounted for. The price range for the day would increase, and that difference, or higher volatility, would be included in the true range.
For some stocks and commodities, during volatile times, this is fairly significant. For example, a stock closing at Rs.100, then opening the next day at Rs.110, and that trades between the opening Rs.110 and Rs.115, would only show a Rs. 5 range, whereas the stock had actually risen Rs. 15 points from the day before.
What is the Average True Range (ATR)?
There are three different scenarios that you will observe when trying to calculate the True Range
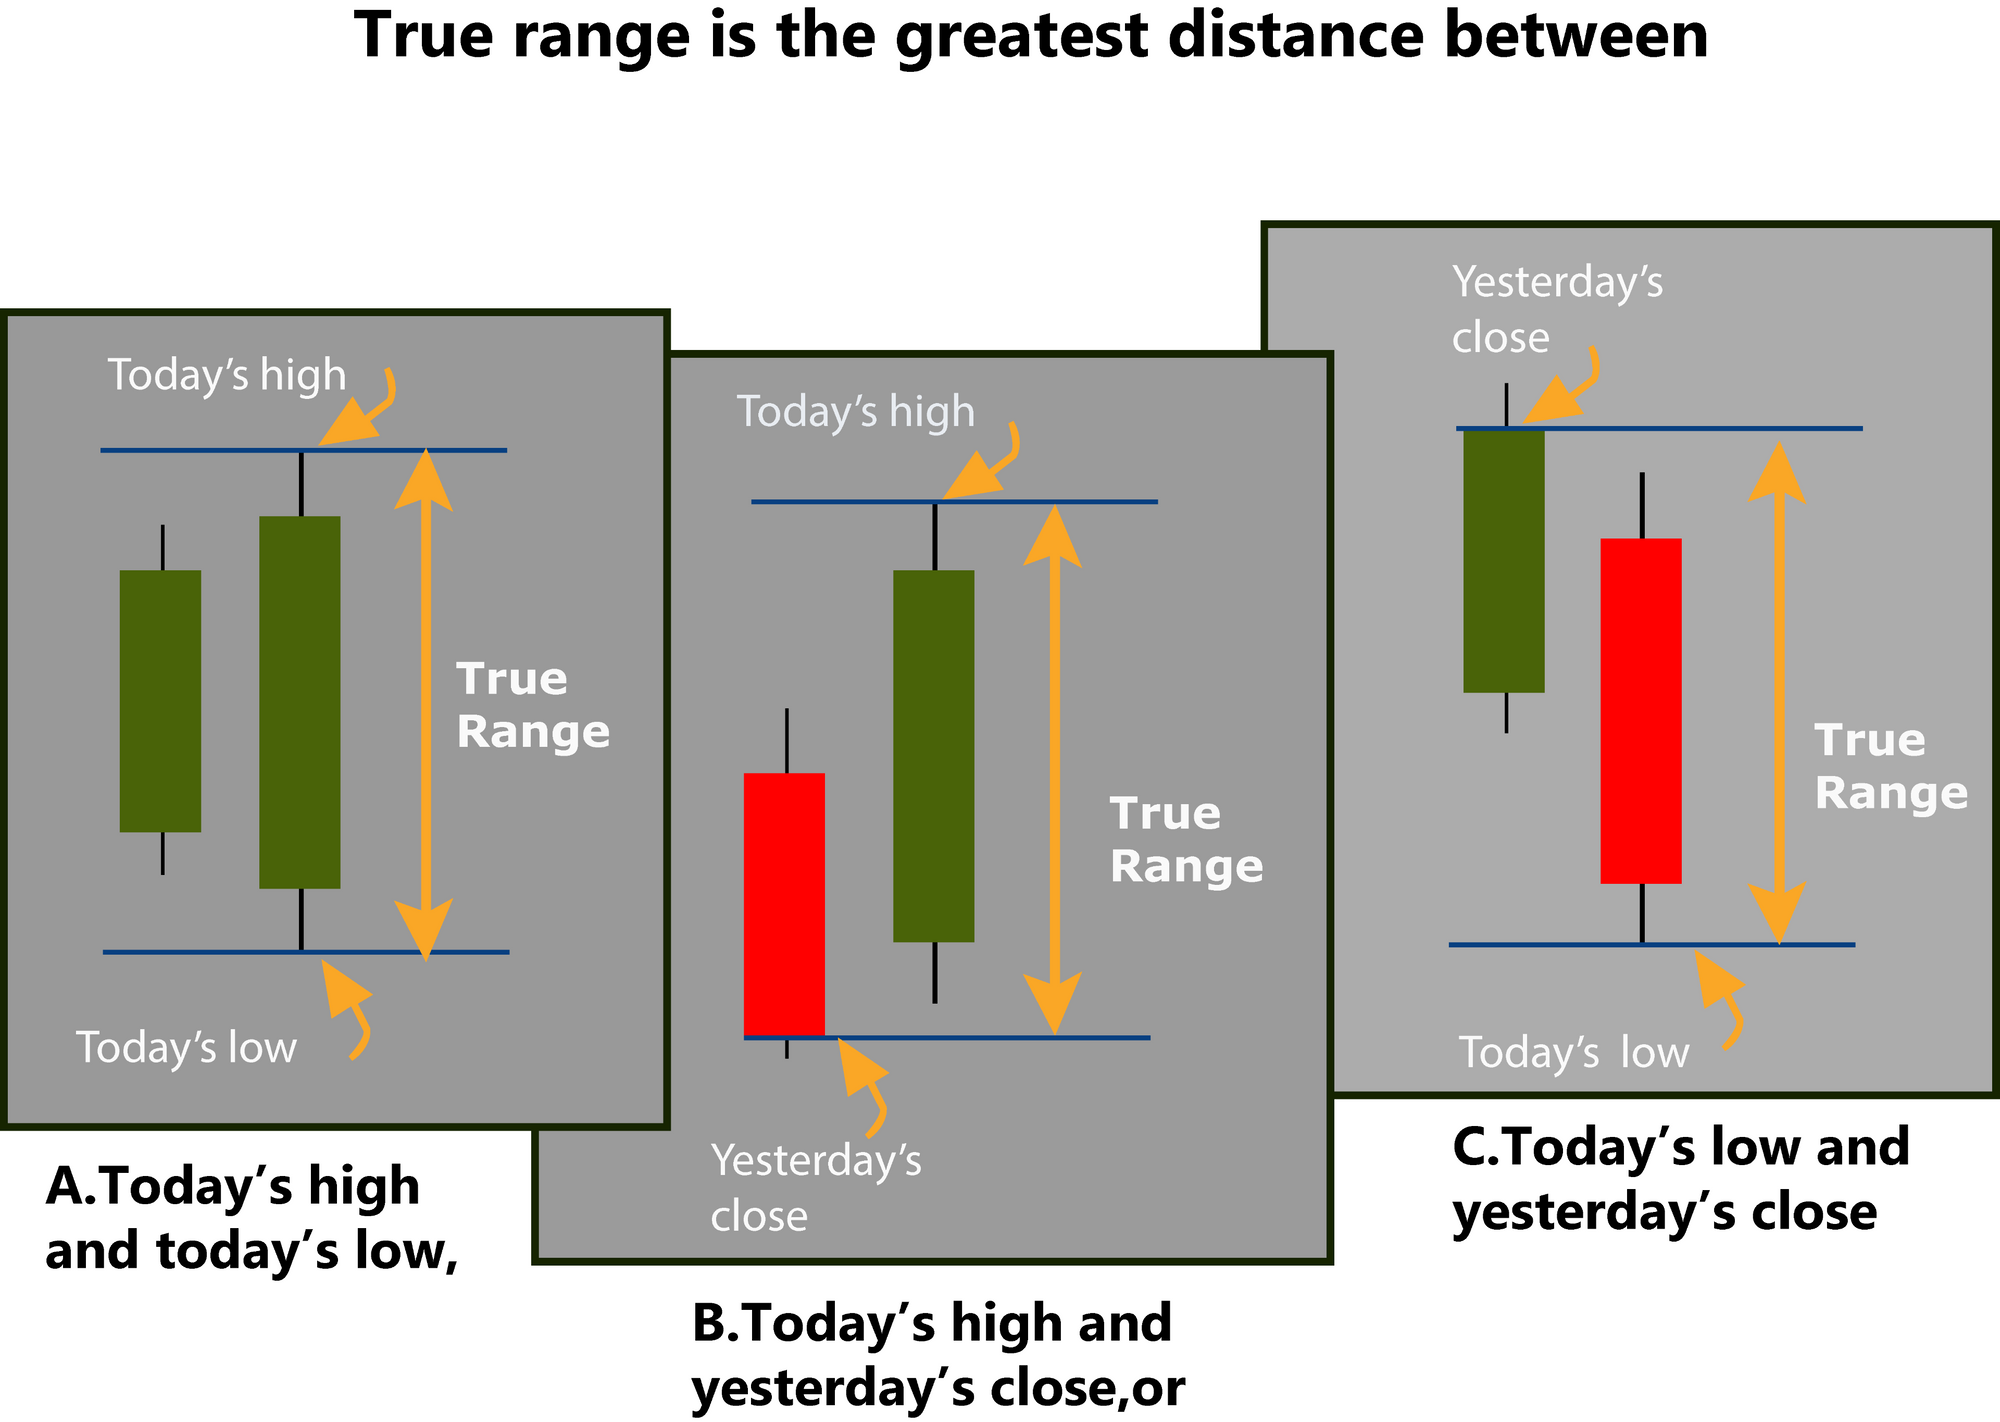
True range is always calculated as an absolute value, meaning that the smaller price(opening or closing) will be subtracted from the larger, therefore always assuring a positive number and the ATR is nothing but an average of true ranges for the period specified, default being 14.
Average true range necessarily does not predict anything(the direction of the stock and ATR have no correlation), as you can see from the figure below
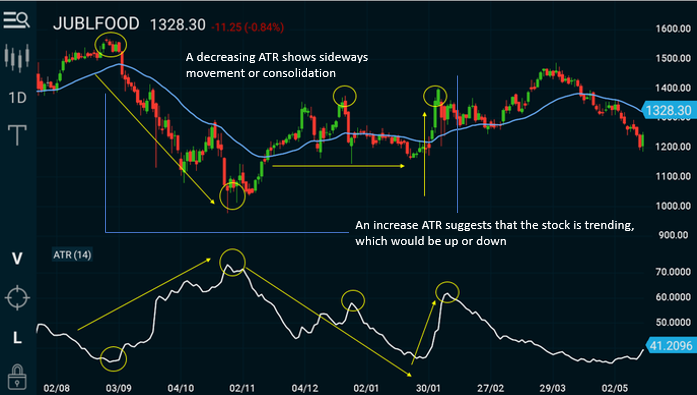
But extremes in activity can indicate a change in a stock’s movement(the circled points). The only indication from ATR’s is that higher ATRs can mean a stock is trending, and lower ATRs could indicate a consolidation in price. Whether the stock is trending up or down, the range is always positive. This is because as such, ATR can be used to validate the interest behind a move or breakout.
How Traders Can Use ATR?
Day traders can use the ATR to project profit targets and also to check if a trade should be taken on.
Consider this 5 minute chart of SBIN below. The stock has an ATR(14) of 10 on its daily chart. On the 23rd May, it opens with a gap-up from its previous close of Rs. 342.40 and hits a high of Rs. 358.50 in its first 15 minutes of trading. The price has already moved 60% more than it normally does(Rs. 16 up compared to an ATR of Rs. 10)
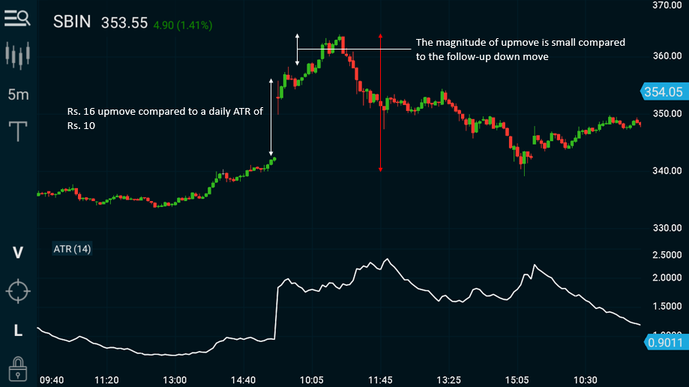
Now, let’s say the trader gets a buy signal from his strategy. While the buy signal may be a valid one, taking a bet that the price will continue to go up and expand the range even further may not be a wise decision. Taking the trade goes against the odds of success. Since the price has already moved more than it normally does, the price is more likely to fall or trade within the price range already established. And that’s what happens with SBIN. The stock does go up marginally by another Rs. 5, but quickly retraces to fall almost Rs. 25 to a low of Rs. 339 for the day.
While buying once the price is near the top of the daily range—and the range is well beyond average—isn't advisable, selling or going short, in this case, is often the better choice assuming a valid trade signal occurs in your strategy.
Another key point I’m trying to bring across is that entries and exits should not be based on ATR alone. ATR is an additional tool that is used with a strategy to help filter trades. For example, in the situation above, a trader shouldn't sell or short simply because the price has moved up and the daily range is larger than usual. Only if a valid sell signal occurs, based on the trader's strategies, would ATR help confirm the trade.

Intraday Traders Beware
If a trader is using an ATR on an intraday chart, especially in the range of 1 minute to 5 minute, you should be aware that the ATR is likely to spike up sharply right after the market opens. Since, the opening is the most volatile time of the day, the gaps and sharp moves can cause the 5 minute or lower timeframe charts to show large increases in ATR. After the spike at the open, ATR typically spends most of the day declining.
Setting Realistic Target Expectations on your Trades
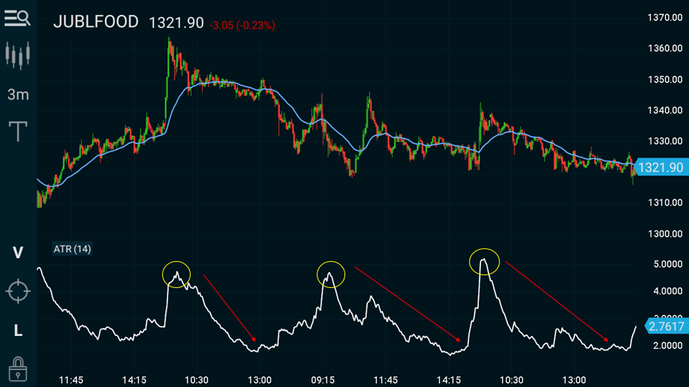
If we look at the JUBLFOOD chart above, and let’s say you get a short trade on the 28th at 12.00 am. The price is at Rs. 1345 and the ATR on the 3 min chart is at approximately 2. Based on the ATR, one can expect that that if you’re expecting a downside of Rs. 30 on the stock, it would take a minimum of 45 minutes at least if not more to play out.
This type of analysis helps the trader in having a realistic expectation about what is likely or unlikely to occur. Traders have a tendency to think that as soon as they enter a trade, the price will magically surge to their profit target.
Studying ATR shows the real movement of the price. Take your expected profit(Rs. 30), divide it by the ATR(2), and that is typically the minimum number of bars(15 bars of 3 mins = 45 mins) it will take for the price to reach the profit target.
Even though ATR changes throughout the day, it still provides a good estimation of how far we can expect the price to move and how long it could take.
Trailing Stops & Envelopes
ATR is also an excellent indicator for using as a trailing stop loss indicator. We have used the Parabolic Stop and Reverse (PSAR) earlier in this series.
In the coming week, we’ll look at how one of the most popular indicators Supertrend is also a derivative of the ATR. Further in the series, we will also see how an envelope called the Keltner Channel - again, derived from the ATR, is an excellent indicator to combine with other indicators to produce good trading results. See you next week.