In this article, I will take two of the better-known technical indicators, namely Bollinger bands and Relative Strength Index (RSI), and go through the steps involved in developing a trading system.
If you’ve just started reading our course blog, I would recommend you to take a look at our introductory article to understand how to pick your indicators. In our second article, we also built our first strategy using the PSAR and Stochastic indicators.
To begin with, let’s first take a closer look at each of the indicators that we have picked for our system.
Bollinger Bands
John Bollinger, creator of the Bollinger Bands defines Bollinger bands as ''a technical analysis tool, which is a type of trading band or envelope''.
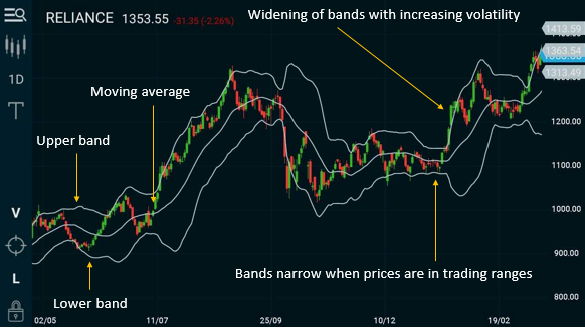
Bollinger Bands are volatility bands which are plotted above and below a central measure of price, using a statistical measure called standard deviation. They consist of three bands, which revolve around a simple moving average (SMA), with the default value of 20, of which it has been observed that 85% of the time, the price is held within the two boundaries:
- Lower band – SMA (minus two standard deviations)
- Upper band – SMA (plus two standard deviations)
The standard deviation is known to increase as price ranges widen and decrease in narrow price ranges. Hence, the bands
- widen when volatility increases, and
- contract when volatility decreases, as shown in the figure below.
Bollinger bands provide a lot of useful information like:
- Trend continuation or reversal
- Periods of market consolidation
- Periods of upcoming large volatility breakouts
- Possible market tops or bottoms, and potential price targets
When using trading bands, it is the price action as it nears the edges of the band that should be of particular interest to us. For a trader, trading near the outer bands provides an element of confidence that there is resistance or support, however, this alone does not provide relevant buy or sell signals; all that it determines is whether the prices are high or low, on a relative basis. Also, care should be taken with stop losses when price closes outside the Bollinger Bands, they are continuations, not reversal signals(this has been the basis for many successful volatility breakout systems).
Given this information, a trader can enter either a buy or sell trade by using indicators to confirm their price action. Let us now, understand a little more about the Relative Strength Index (RSI), a momentum indicator that can be effectively combined with the Bollinger Bands.

Relative Strength Index(RSI)
The RSI is a leading momentum indicator that compares the number of days a security closes up versus closing down over a period of time.
The formula for the RSI indicator takes two equations that are involved in solving the formula. The first component equation obtains the initial Relative Strength(RS) value, which is the ratio of the average'Up'' closes to the average of'Down' closes over'N' periods represented in the following formula:
RSI = Average of 'N' day 's closes up / Average of 'N' day's closes down
The actual RSI value is calculated by indexing the indicator to 100, through the use of the following formula:
RSI = 100 - (100 /1 + RS)
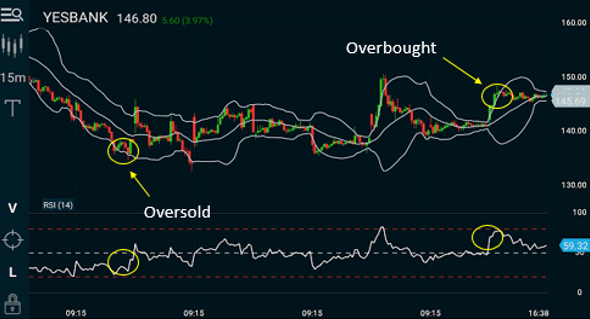
These values are then plotted on a range from 0 to 100. If the RSI is less than 30, it means that the market is oversold, and that the price might increase. Conversely, if the RSI is more than 70, it means that it's overbought, and that the price is likely to fall. The 50 level is the midline that separates the Bulls and the Bears. In an uptrend, the RSI is usually above 50, while in a downtrend, it is below 50.
The Combination Trading Strategy
I selected this combination as you can determine when prices will reverse from a Bollinger Band and are likely to move all the way to the other band with the RSI moving out in tandem from overbought or oversold conditions.
This simple strategy only triggers when both the RSI and the Bollinger Bands indicators are at the same time retrieving from an overbought or an oversold condition.
Of course, those prices may not move all the way, so you will need to use stops for protection. Also, always bear in mind, not only with this strategy, but as a thumb rule, to use a simple money management strategy of allocating only a portion of your capital to any one position.
1) Long Entry
A long entry should be made when all the conditions are met:
Daily Chart
- Previous Day closes below lower BB.
- Current Day closes above lower BB.
- Previous RSI closes below 30.
- Current RSI closes above 30.
Stop Loss
The low of previous day or current day, whichever is lower.
Target
Trailing stop losses and riding the trend is an effective strategy here. One should exit if a sell signal is generated.
2) Short Entry
A short entry should be made when all the conditions are met:
Daily Chart
- Previous Day closes above higher BB.
- Current Day closes below lower BB.
- Previous RSI closes above 70.
- Current RSI closes below 70.
Stop Loss
The high of previous day or current day, whichever is higher.
Target
Trailing stop losses and riding the trend or exit if a buy signal is generated.
Setting an Alert- Buy strategy
Setting an Alert- Sell strategy
If one wants to ensure that you are trading in the direction of the longer term trend, you can consider looking at a 50 period EMA and only trade when the direction of your entry matches the direction. You’ll get fewer signals, but will protect yourself from several wrong signals. Good luck!